
Processor rails & heat map
Package and per-core thermals sit beside Vcore and VID hints so you can validate BIOS tuning on both blue and red platforms.
HWMonitor listens to the same health rails technicians watch—thermals, supply voltages, spin rates, and storage warnings—without slowing the machine down.
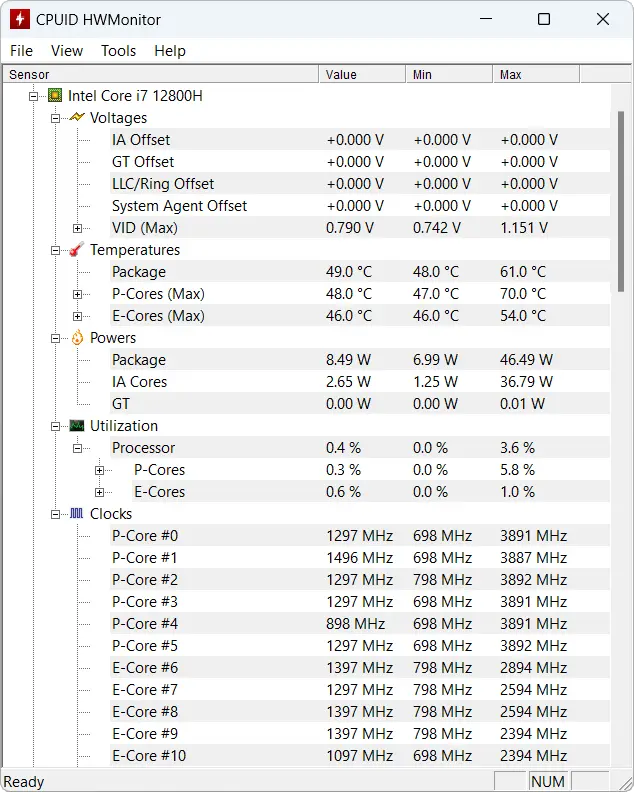
HWMonitor groups the noisiest signals—compute heat, graphics load, and storage risk—so you can react before throttles or brownouts appear.
Package and per-core thermals sit beside Vcore and VID hints so you can validate BIOS tuning on both blue and red platforms.
Edge and junction numbers, fan duty cycles, and VRAM context update together so you can correlate spikes with frame-time dips.
SMART counters, reallocated sectors, and drive temps surface early, giving you runway before arrays degrade silently.
Ships for Windows 10 and 11 in both 32- and 64-bit slices—pick the build that matches your image.
It taps the same on-die diode feeds your card firmware uses, so spikes line up with OEM tuning utilities—not synthetic estimates.
When the silicon exposes it, you will see slot draw plus supplemental PCIe power in watts, including brief peaks during transient loads.
Those traces map to motherboard zones—socket skirts, VRM banks, PCH neighbors—so vendors can surface board-level hotspots beyond the CPU lid.
HWMonitor stays offline by default: no bundled toolbars, no crypto miners, and no telemetry uploads—just local bus reads rendered in plain text rows.
Review the trust desk write-up