
Processor telemetry you can log line-by-line
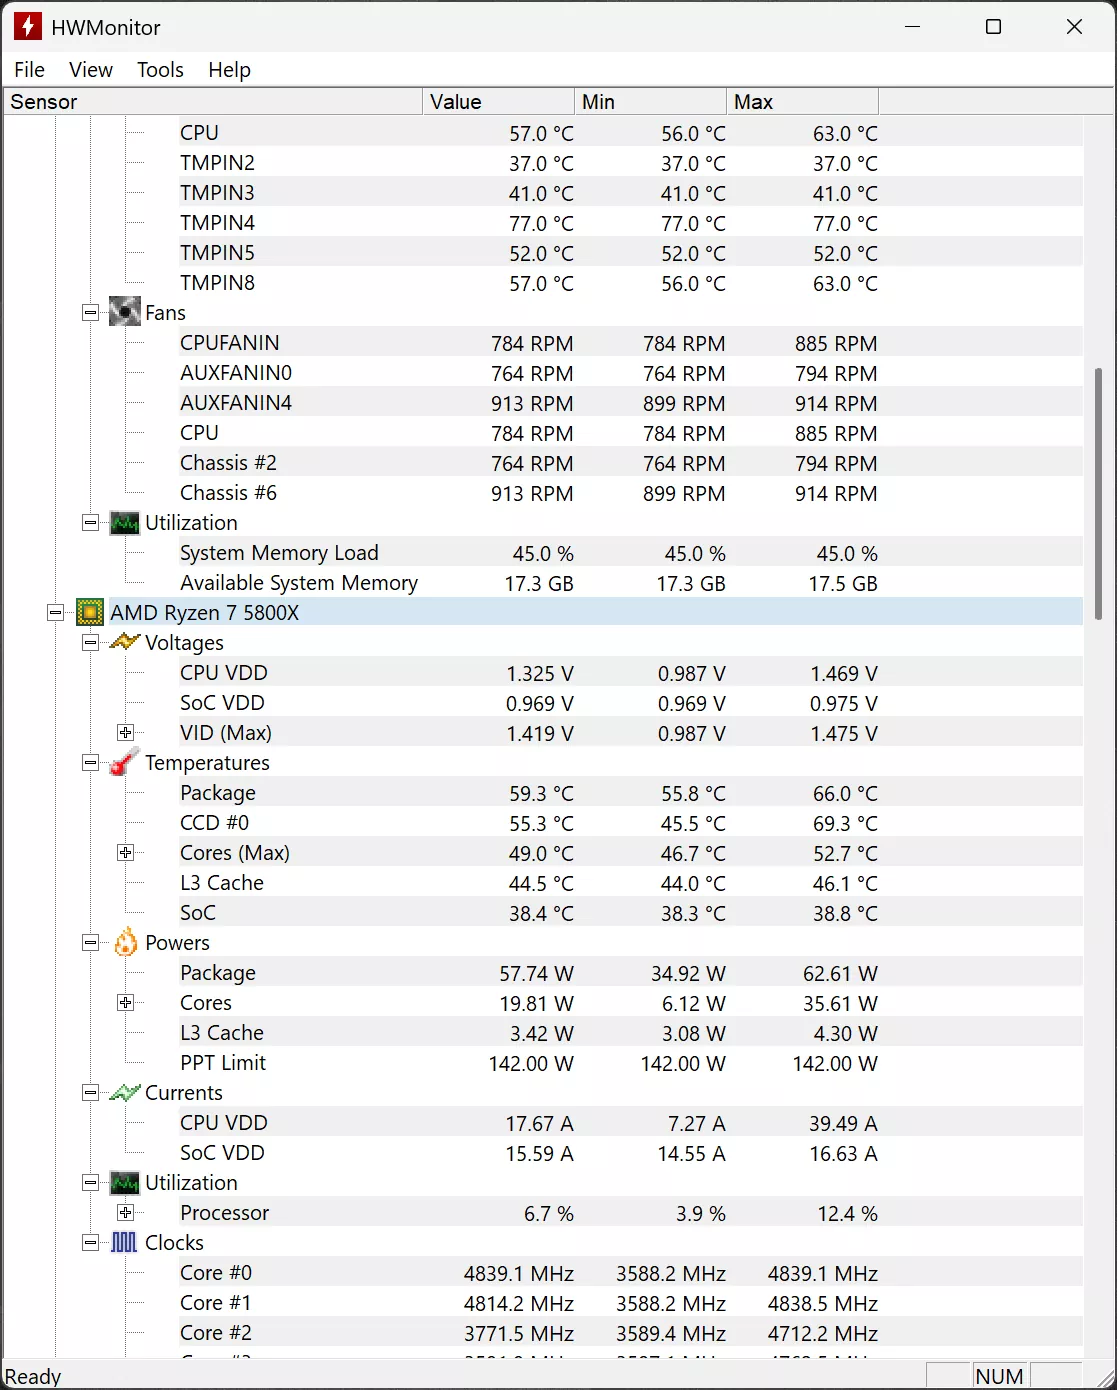
HWMonitor keeps per-core deltas, VID requests, and package power in the same column family so you can correlate firmware limits with what the silicon actually reports.
- Heat ladders: Spot a single hot core versus a whole-package throttle before the cooler saturates.
- Rail discipline: Watch Vcore sag during AVX bursts to validate PSU headroom and LLC tuning.
- Clock transparency: Every active core’s MHz is visible for quick P-state debugging.
Graphics silicon without the marketing gloss
HWMonitor reads what the VBIOS exposes—junction versus edge, PCIe budget, and VRAM thermals—across NVIDIA, AMD, and Intel Arc when the driver cooperates.
- Hotspot honesty: Track the die’s hottest region instead of a single edge diode that flatters the chart.
- Slot vs. brick power: Compare PCIe slot draw with 6/8-pin feeds when transient spikes trip OCP.
- VRAM guardrails: Junction temps sit beside core clocks so you can throttle texture budgets early.
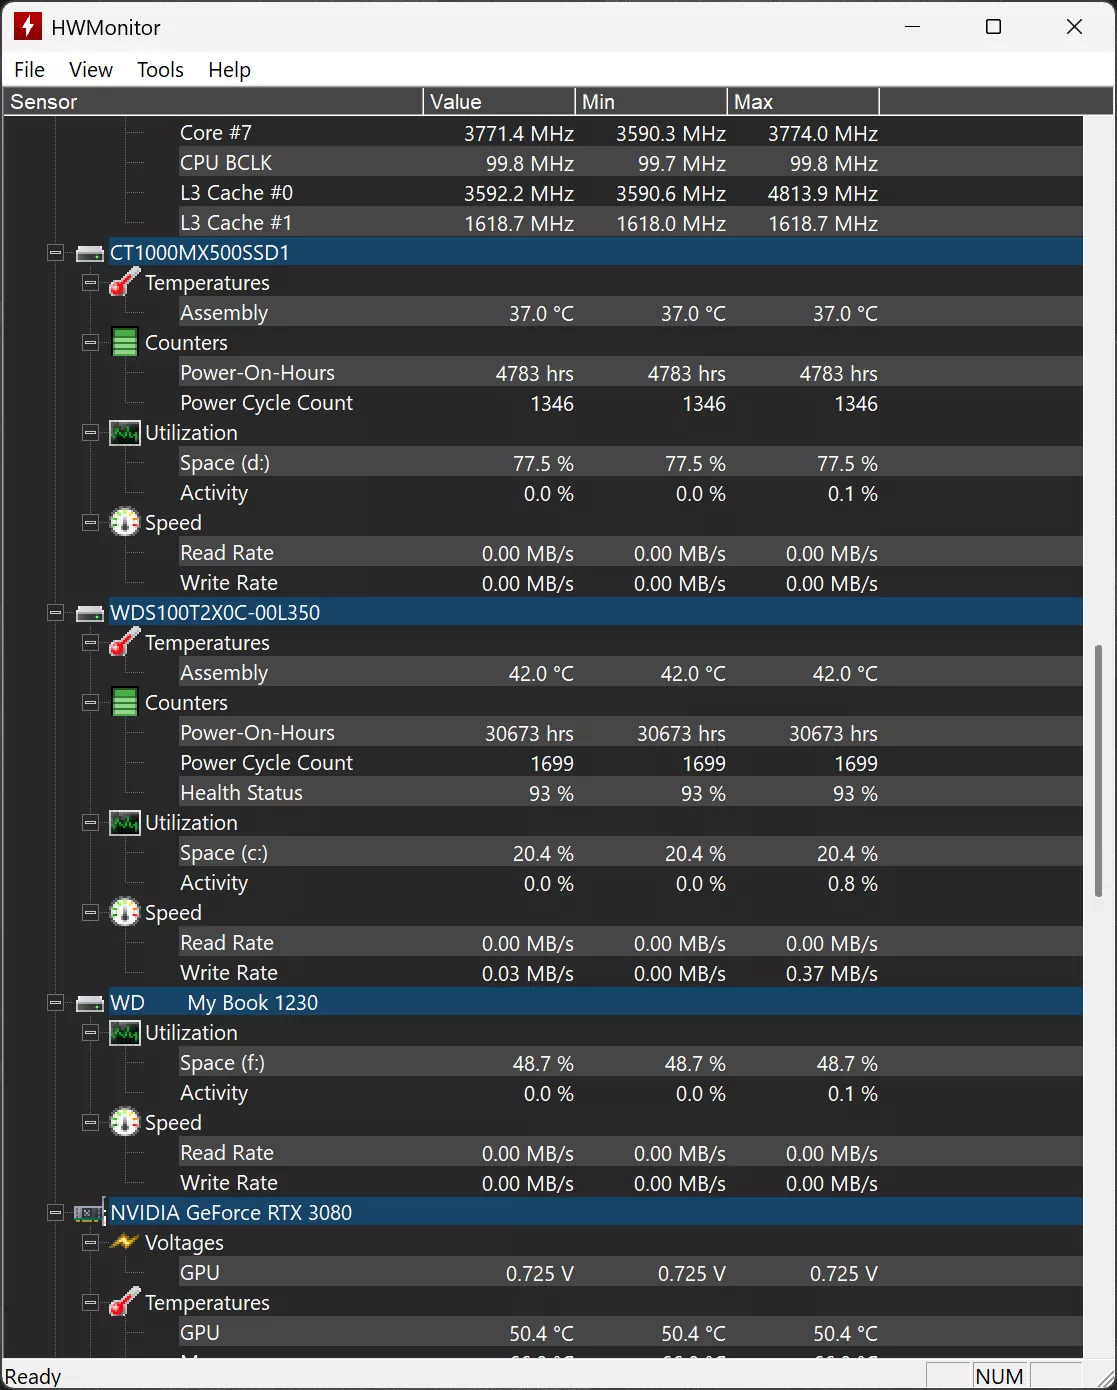
SMART counters that age gracefully
HWMonitor lifts reallocated sectors, pending counts, temperature probes, and endurance left on SSDs so you can retire spinning rust before SMART trips silently.
Notebook power chemistry
Compare design capacity against full-charge capacity, watch charge/discharge wattage, and estimate wear without a separate OEM utility.
Registry + CLI hooks
Handy when IT needs reproducible logs or you script sensor dumps.
Registry hive
HWMonitor persists UI preferences under the standard vendor hive shown below.
HKEY_LOCAL_MACHINE\SOFTWARE\CPUID\HWMonitorCLI switches
Dump verbose sensor traces when a board misreports or a driver hides half the tree.
hwmonitor.exe -log=1